

Search
Housing prices with median and average
RAND State Statistics recently updated its Housing Prices database with median and average listed housing prices, from the year 2016 to the year 2021. The database also includes square footage, listings, and pending sales. Here are some of the highlights.
The median list price for a home in the United States increased by 12.7% between June 2020 and June 2021 (see Table 1). The highest percentage increases were in Idaho (37.7%), Utah (28.1%), Connecticut (24.2%), and Montana (22%). Median list prices actually fell in four states: the District of Columbia (-15.4%), Rhode Island (-4.5%), Oklahoma (-3.8%), and Iowa (-2.3%). Median list prices were unchanged in two states, Kansas and Ohio.

Table 1—Housing Prices, Median List Price, June 2020 - June 2021
Figure 1 shows the states with the highest housing price increases and Figure 2 shows the states with the lowest housing price increases from June 2020 to June 2021. Interestingly, the area of the country with the lowest housing price increases is the Midwest. In particular, the median list price of a house in Iowa fell 2.3%.

Figure 1—States With Highest Housing Price Increases, June 2020-June 2021

Figure 2—States With Lowest Housing Price Increases, June 2020-June 2021
The median list price for homes also increased significantly between June 2016 and June 2021 (see Table 2). Similar to trends over the last year, the highest percentage increase was in Idaho at 111.5%. Prices also increased significantly in New York (92.4%), Utah (81.2%), Washington (67.8%), and Indiana (62.9%). The five-year increase for the U.S. as a whole was 48.1%. Price increases were uneven across the U.S., with four states reporting under 10%. The lowest was in the District of Columbia with 2.2%; prices increased 6.0% in West Virginia, 7.1% in Hawaii, and 9.6% in North Dakota.

Table 2—Housing Prices, Median List Price, July 2016 - June 2021
Figure 3 indicates the median list price for the United States between January 2016 and June 2021. As shown, the median price has increased from roughly $250,000 to just under $400,000, indicating an average monthly increase of $1,900.
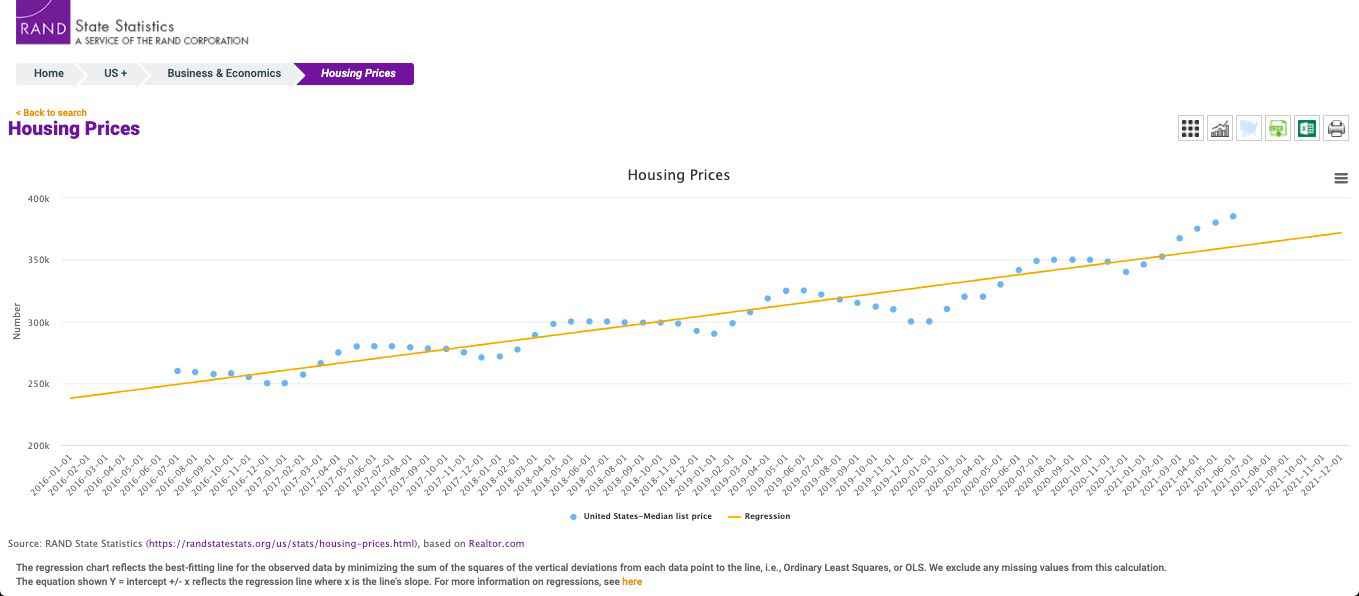
Figure 3—Housing Prices, U.S Median List Price, July 2016 - June 2021
Figure 4 compares the median list price for the United States and four states with the highest increase over the last five years. The median list price in Idaho increased 37.7%, reaching $550,000. In Utah, the median list price increased 28.1%, reaching $597,700. The median price in Connecticut increased by 24.2%, reaching $494,450 and the median price in Montana increased by 22%, reaching $482,000. These increases are almost double or more the U.S average of 12.7%.

Figure 4—Housing Prices, July 2016 - June 2021