

Search
Residential Building Permits
RAND State Statistics recently updated its Residential Building Permits database, containing building permits for new privately-owned residential construction. This includes the number of new units and construction valuation. Valuations are expressed in dollars. Single-unit buildings are defined as total fully detached, semidetached (semiattached, side-by-side), row houses, and townhouse buildings. Here are some of the highlights.
The U.S Bureau of the Census reported 1,117,645 single-unit permits in October of 2021 (the latest month available), compared to 1,171,794 single-unit permits in January of 2000, a 4.6% decrease (See Figures 1 and Figure 2). If we assume current 2021 trends continue, the growth rate for 2021 compared with 2020 will reach 27.2%. The U.S. did reach levels near the 2017 growth rate, 24.3% in 2012 and 20.2% in 2013. The U.S. single-unit permit growth rates experienced it’s lowest levels over the last 21 years between 2006 and 2009. The worst performance was in 2008, when the rate declined by 41.3%. The 2007 performance was similar at a 29.1% decline. The decline in 2006 was lower at 17.6%, and the decline in 2009 was 23.7% (See Table 1).

Figure 1 - Single Residential Building Permits, United States, January 2000
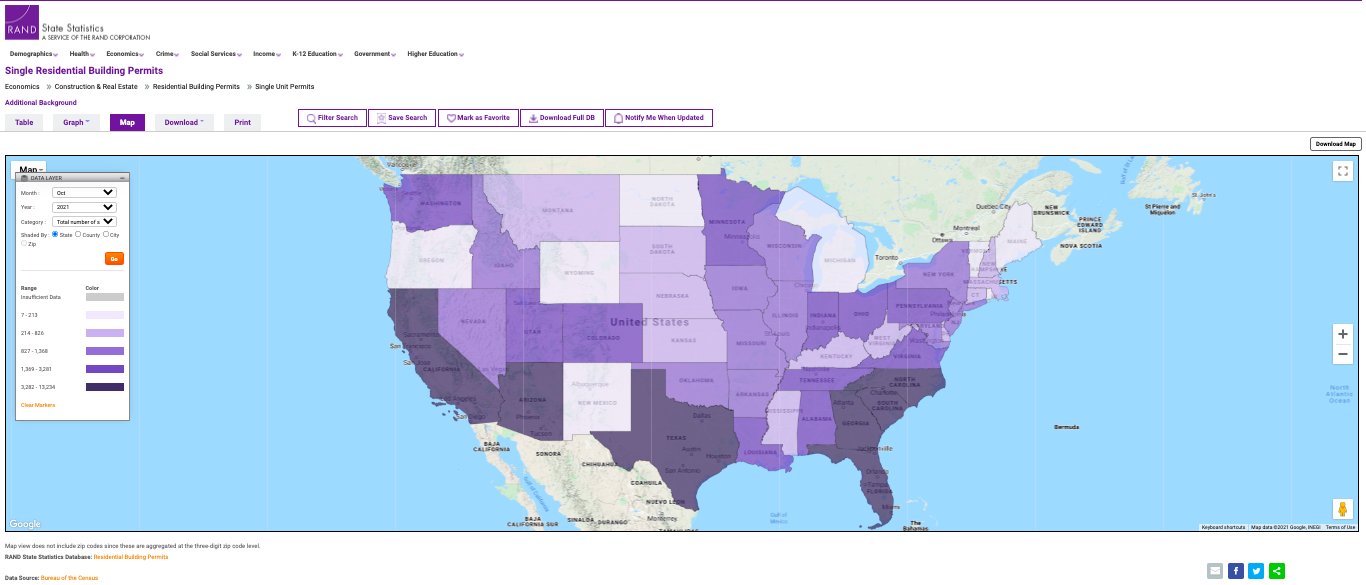
Figure 2 - Single Residential Building Permits, United States, October 2021

Table 1 - Single Residential Building Permits, United States Totals, 2000-2021
Growth patterns were similar in most states. For example, California experienced a decrease in single-use permits from 2000 to 2021, dropping 35.3% from 102,248 in 2000 to a projected 66,603 in 2021. If we assume current 2021 trends continue, the annual growth rate for single-unit permits in 2021 will reach 22.5%, nearly 5 percentage points lower than that in the United States. The last time single-unit permits reached this level was in 2013 at 33.2%, almost identical to the annual growth rate of 22.6% in 2012. California single-unit permit growth rates also experienced their lowest levels over the last 21 years between 2006 and 2009. Comparably to the U.S., the worst performance was in 2008, when the rate declined by 51.9%. The 2007 performance was similar at a 35.2% decline. The decline in 2006 was lower at 30.6%, and the decline in 2009 was 24.3% (See Table 2).

Table 2 - Single Residential Building Permits, California Totals, 2000-2021
To compare the United States and California single-unit permits from 2000 to 2021, see Figure 3.

Figure 3 - Single Residential Building Permits, United States and California, 2000-2021