

Search
U.S Public State High School Graduation Rates Increase
RAND State Statistics recently updated its State Public High School Graduates database, reporting the number of public high school graduates by state or jurisdiction. Data include regular diploma recipients, but exclude students receiving a certificate of attendance and persons receiving high school equivalency certificates.
From 2020 to 2021, public state high school graduates in the United States increased by 0.2% (See Table 1). Wyoming had the largest public state high school graduates growth during this time (3.6%), followed by South Dakota (3.5%), Utah (3.0%), North Dakota (2.7%), and Colorado (2.4%); while the District of Columbia graduation rates fell by -7.6%, followed by Louisiana (-4.0%), West Virginia (-3.3%), Alabama (-2.8%), and Mississippi (-2.8%) (See Figure 1).

Table 1 — State Public High School Graduates, 2020 - 2021
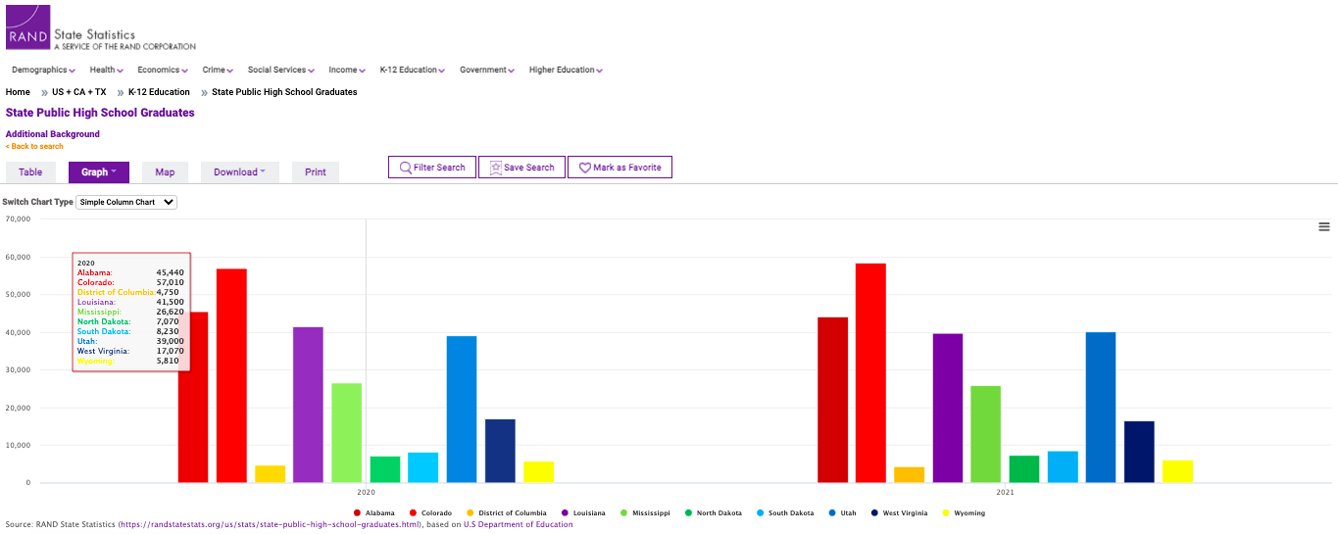
Figure 1 — State Public High School Graduates, 2020 - 2021
From 2017 to 2021, the United States saw a 1.4% growth of public high school graduates (See Table 2). The states with the highest growth during this five-year period were Montana (9.9%), Utah (9.9%), Rhode Island (9.5%), Nebraska (8.3%), and Colorado (7.9%) and the states with the lowest growth were Vermont (-8.0%), Alabama (-7.2%), West Virginia (-5.0%), Michigan (-4.3%), and Mississippi (-3.8%) (See Figure 2).

Table 2 — State Public High School Graduates, 2017 - 2021

Figure 2 — State Public High School Graduates, 2017 - 2021
The United States public high school graduates rates followed similar trends and grew from 2,281,317 in 1996 to 3,224,140 in 2016, an increase of 41.3% (See Table 3). Over this 20-year period, Arizona had the largest graduates rate increase (123.7%), followed by Nevada (123.5%), Florida (86.6%), Texas (85.4%), and Georgia (77.8%); states with the least growth were West Virginia (-13.3%), North Dakota (-12.5%), Montana (-8.1%), South Dakota (-5.3%), and Wyoming (-3.3%) (See Figure 3).

Table 3 — State Public High School Graduates, 1996 - 2016

Figure 3 — State Public High School Graduates, 1996 - 2016
From 1996 to 2021, the United States saw a 44.8% growth of public high school graduates (See Table 4). During this 25-year period, Nevada had the largest growth (144.3%), followed by Arizona (125.6%), Texas (104.0%), Florida (95.9%), and Georgia (87.9%). The smallest growths were seen in West Virginia (-18.9%), North Dakota (-9.6%), Vermont (-5.8%), South Dakota (-0.1%), and Montana (1.7%) (See Figure 4).

Table 4 — State Public High School Graduates, 1996 - 2021

Figure 4 — State Public High School Graduates, 1996 - 2021
For state-by-state public state high school graduate comparisons, see Figures 5 and 6.
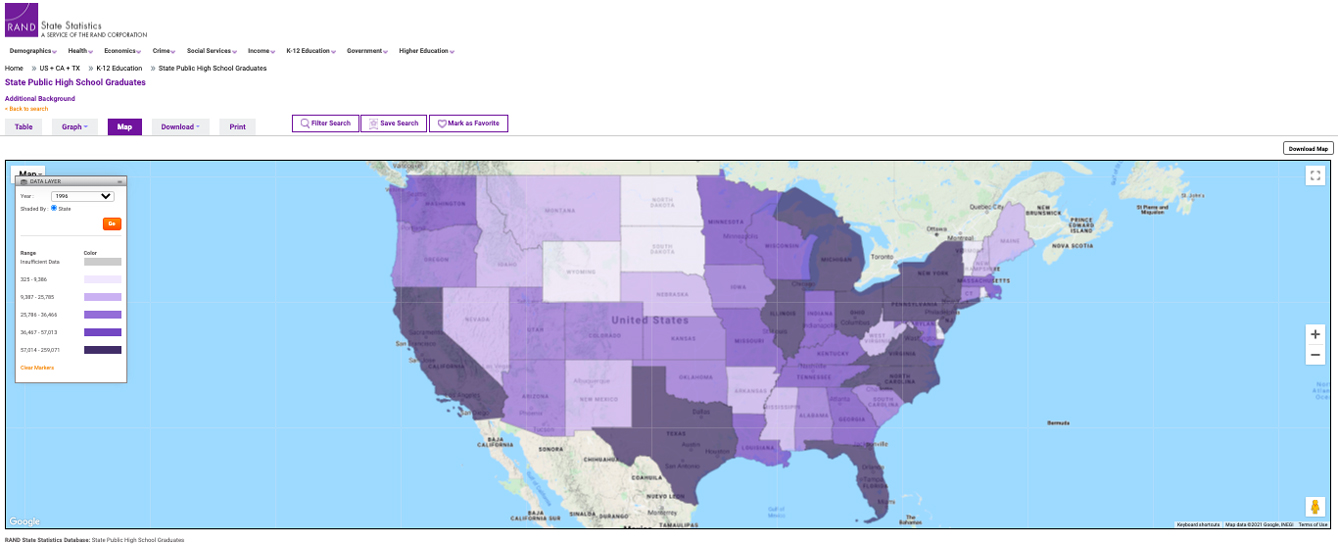
Figure 5 — State Public High School Graduates, 1996

Figure 6 — State Public High School Graduates, 2021