

Search
Global Greenhouse Gas (GHG) Emissions
RAND State Statistics recently updated its Global Greenhouse Gas (GHG) Emissions database, reporting Greenhouse Gas (GHG) emissions from fossil-fuel burning, cement production, and gas flaring by country and source, expressed in thousands of metric tons of carbon or thousands or metric tons of CO2 as indicated.
From 2007-2017, carbon and CO2 emission growth both decreased by 14.4% in the United States (see Table 1). The countries with the highest carbon emission growth during this time were Laos (909.9%), Nepal (334.6%), Mozambique (276.9%), Iraq (239.0%), and Zambia (233.6%). The counties with the lowest growth were Aruba (-67.5%), North Korea (-65.7%), Syrian Arab Republic (-59.9%), Yemen (-51.8%), and Malta (-43.9%) (See Figure 1).
Similarly, Laos (909.8%), Nepal (334.7%), Mozambique (277.0%), Iraq (239.0%), and Zambia (233.5%) had the largest CO2 emission growth from 2007-2017, while Aruba (-67.5%), North Korea (-65.7%), Syrian Arab Republic (-59.9%), Yemen (-51.8%), Malta (-43.9%) saw the largest decreases of emission growth (See Figure 2).
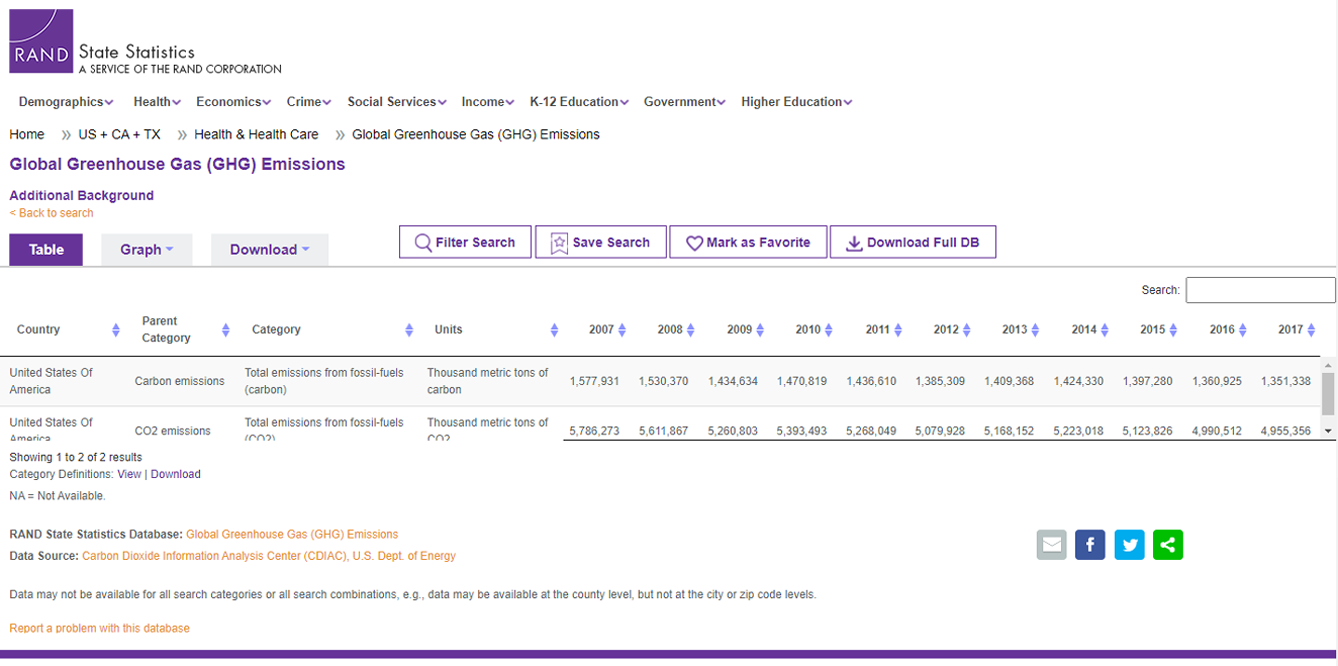
Table 1 — Global Greenhouse Gas (GHG) Emissions - Carbon and CO2 Emissions, 2007-201

Figure 1 — Global Greenhouse Gas (GHG) Emissions - Carbon Emissions, 2007-2017

Figure 2 — Global Greenhouse Gas (GHG) Emissions - CO2 Emissions, 2007-2017
The United States saw a 5.7% growth for carbon and CO2 emissions from 1987-2017 (See Table 2). The countries with the highest carbon emission growth during this 30-year period were Laos (8693.1%), Equatorial Guinea (5944.4%), Cambodia (2525.2%), Maldives (1759.1%), and Gibraltar (1353.8%). (These abnormally high growth rates reflect very low emissions in 1987, the base year.) The lowest carbon emission growths were seen in North Korea (-87.6%) Nauru (-69.8%), Romania (-65.6%), Bulgaria (-51.5%), and Denmark (-45.5%) (See Figure 3).
Following similar trends, Laos (8680.3%), Equatorial Guinea (5945.5%), Cambodia (2527.5%), Maldives (1751.9%), and Gibraltar (1343.8%) showed the largest growths of CO2 emission from 1987-2017. (These abnormally high growth rates reflect very low emissions in 1987, the base year.) North Korea (-87.6%), Nauru (-69.6%), Romania (-65.6%), Bulgaria (-51.5%), and Denmark (-45.5%) showed the least growth (See Figure 4).

Table 2 — Global Greenhouse Gas (GHG) Emissions - Carbon and CO2 Emissions, 1987-2017

Figure 3 — Global Greenhouse Gas (GHG) Emissions - Carbon Emissions, 2007-2017

Figure 4 — Global Greenhouse Gas (GHG) Emissions - Carbon Emissions, 2007-2017
The total for all countries saw a 63.9% increase of carbon emission growth from 1987-2017 and a 71% growth in CO2 emissions.